
What Over 2,000 Recordings Reveal About How Horses Really Move
Here is something that surprises most people when they first hear it: 95% of horses move measurably differently on their left side versus their right.
Not because something is wrong. Because that is simply how horses are built.
We know this because we have spent the last year recording horses across professional yards in Ireland, the UK, the Netherlands, Spain and the US. More than 2,000 recordings. Over 450 horses. Every recording analysed by the same AI model, tracking 52 anatomical landmarks per frame, measuring the same biomechanical variables each time.
What we found — and what we want to share here — is that natural asymmetry is not the exception. It is the norm. And understanding that changes how you think about movement monitoring entirely.
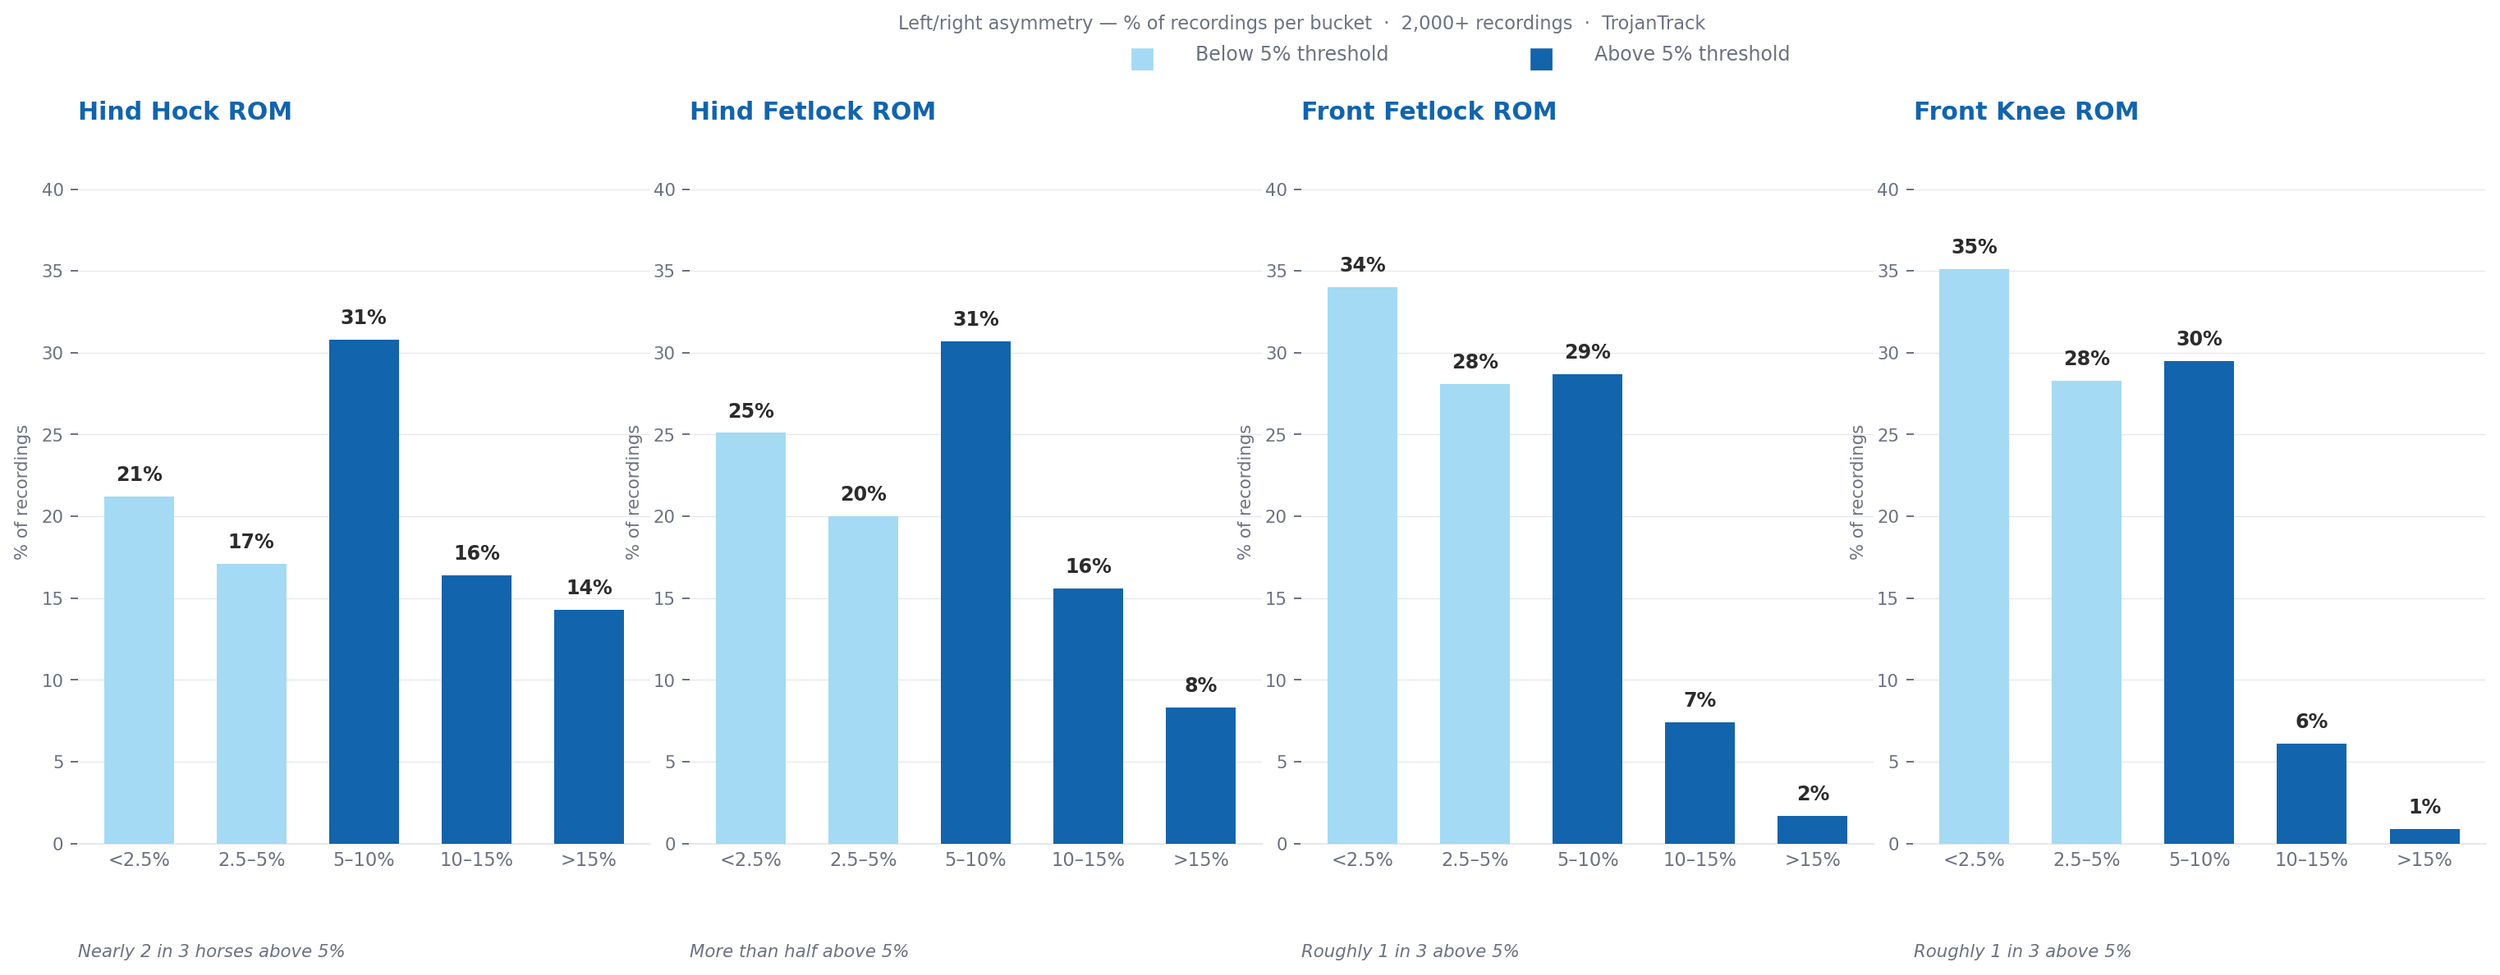
Distribution of left/right range of motion asymmetry across four joint variables, measured across more than 2,000 recordings. Light blue bars represent recordings below 5% asymmetry; dark blue bars represent recordings above it. The hind limbs show notably higher rates of asymmetry than the front.
Natural versus changed
There is an important distinction that sits at the heart of everything TrojanTrack does.
Natural asymmetry is the pattern a horse has always had. One hock flexes a fraction more than the other. The left hind loads slightly differently to the right. The horse has been this way since day one. It is part of how they go.
Changed asymmetry is when that pattern shifts. The hock that always flexed more starts flexing less. A joint that was consistent for months suddenly shows a new deviation. The horse's individual normal has moved — and that movement is worth paying attention to.
Most movement assessment tools compare a horse to a population average, or to a textbook ideal. TrojanTrack compares a horse to itself. That distinction only works if you know what the horse's normal looks like in the first place — which is why building a baseline is not a nice-to-have. It is the whole point.
How we measured this
Every recording in this dataset was taken using the standard TrojanTrack protocol: a single phone on a tripod, positioned side-on, capturing a 10-second walk. Our AI model processes the video frame by frame, tracking anatomical landmarks and computing biomechanical variables for each stride.
We filtered the dataset to recordings marked as good for baseline use — meaning the video quality, frame rate, and filming angle met our minimum standards. That left us with 2,176 recordings across 455 horses.
For this analysis, we focused on 12 variables where we have the highest confidence in our model's outputs. We excluded head movement and hip movement, both of which are noisier in our current model and not yet reliable enough for population-level claims.
The 12 variables we used: stride length (front and hind), stance and swing phase timing (front and hind), range of motion at the front fetlock, front knee, hind fetlock, and hind hock, and vertical velocity of the front and hind limbs.
Where the asymmetry shows up
Hind hock range of motion is the most common site of natural left/right difference in our dataset. Nearly two thirds of horses — 62% — show measurable asymmetry here, with a median difference of 6.6% between sides.
That number is worth sitting with. More than six in ten horses flex their hocks differently left versus right, not because anything is wrong, but because that is their individual way of going. For most of these horses, the difference has been consistent since their first recording. It is part of their pattern.
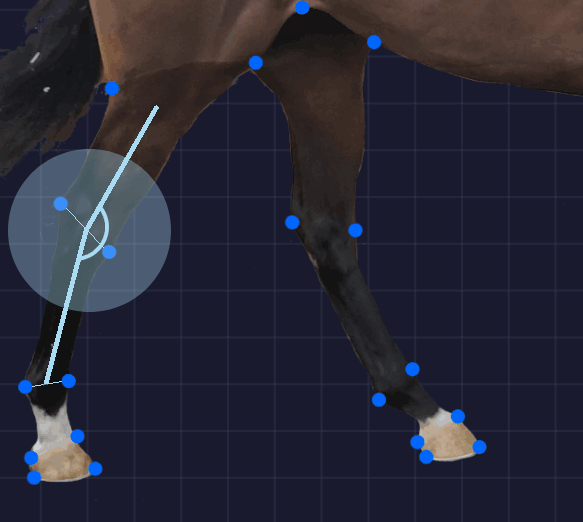
Hock Angle used for Range of Motion (ROM)
Hind fetlock range of motion is the second most common. The hind fetlock absorbs impact on landing and drives propulsion on push-off — it does a significant amount of work in every stride. More than half of all horses in our dataset (55%) show a measurable left/right difference in how that joint flexes, with a median difference of 5.6%.
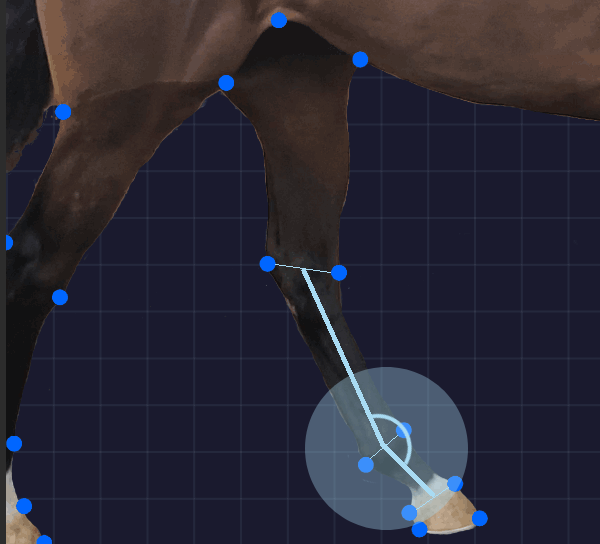
Hind Fetlock Angle used for Range of Motion (ROM)
Front fetlock and front knee show natural asymmetry less frequently — roughly one in three horses for each variable. The front limbs tend to be more consistent. Horses compensate better at the front. But 1 in 3 still show differences that are stable, repeatable, and simply part of how they are built.
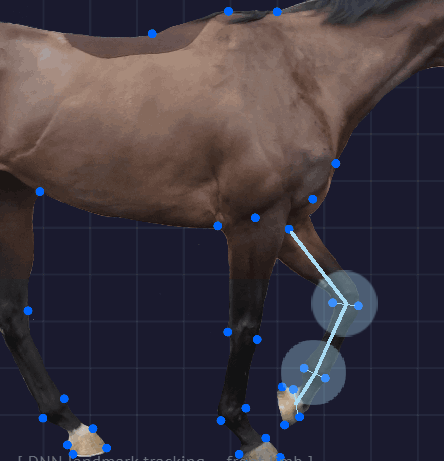
Knee and Fore Fetlock Angle for Range of Motion (ROM)
The finding that surprised us
Stride length — the thing you can actually see when you watch a horse walk — is nearly identical left versus right.
Across the full dataset, the median left/right difference in front stride length is just 2.5 centimetres, on horses with an average stride of around 189 centimetres. That is less than 1.5%. In 96% of horses, stride length is functionally even between sides.
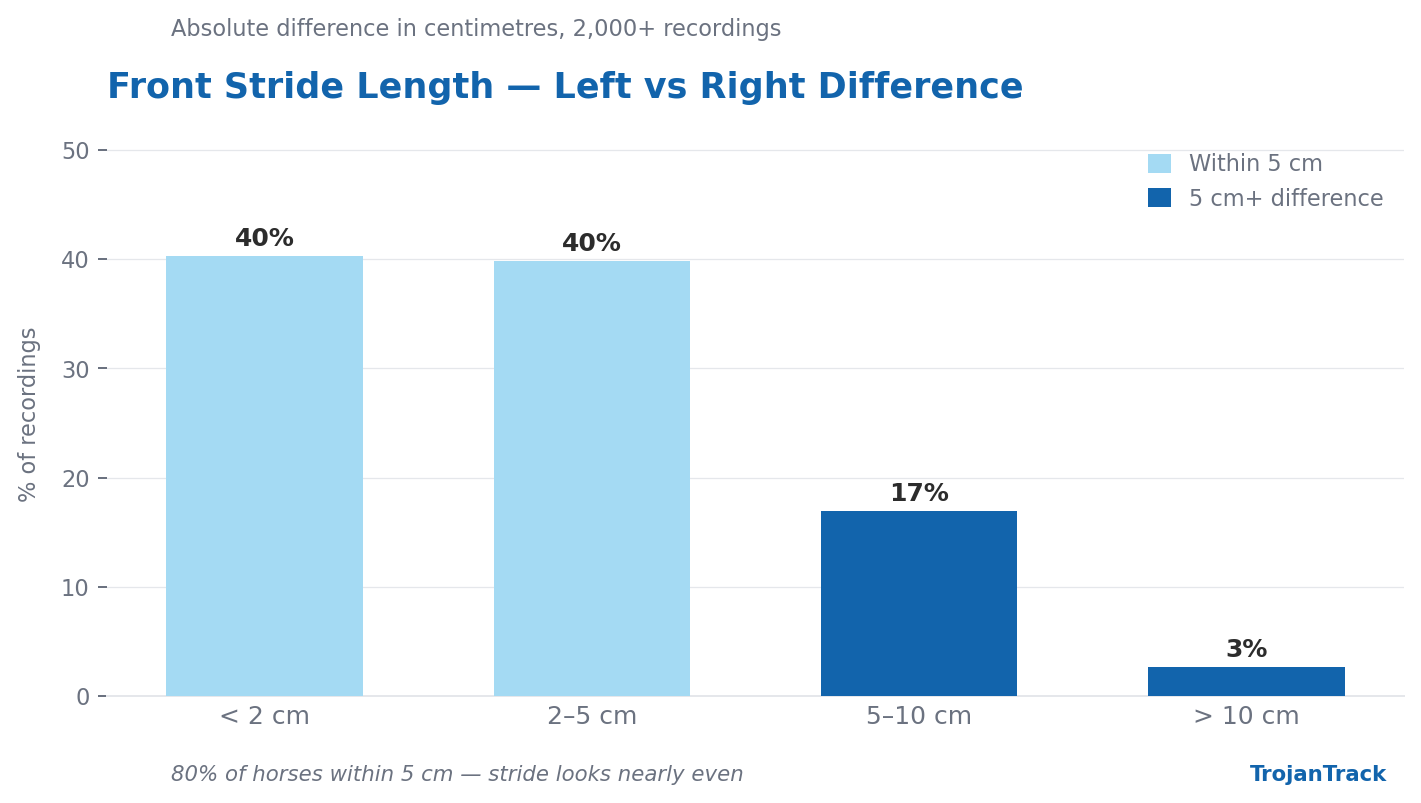
Front stride length difference between left and right legs, measured across more than 2,000 recordings. 80% of horses fall within 5cm
At first glance, that seems to contradict everything above. If joints are asymmetric in 55-62% of horses, why does the stride look the same?
Because horses compensate. They absorb asymmetry through subtle adjustments in joint angle, limb loading, and timing — and they do it well enough that the stride length comes out looking even. The differences live underneath, in the angles and the forces that produce each step, not in the step length itself.
This has a practical implication. Watching a horse walk and seeing an even stride does not mean the movement is symmetrical. It means the horse is compensating effectively enough to look symmetrical. Whether that compensation is sustainable, and whether it has changed, is what the data tells you.
What it looks like over time
Three horses from our active yards illustrate why continuous monitoring matters more than any single reading.
Horse A — a professional showjumping yard.
When first recorded, this horse showed hind hock asymmetry of 33-40%, flagging red on multiple consecutive sessions. Over the following six months of regular recording, that figure reduced steadily: 22% by February, 14% by March, 8% by April, settling at 1-7% by May and June. The system logged a green report in mid-June for the first time.
We do not know the clinical context, whether this reflected treatment, conditioning, or something else. What the data shows is a sustained, directional change over six months that a single assessment would have missed entirely. The trend was only visible because there was a baseline to compare to.
Horse B — same yard.
This horse started with high hind hock asymmetry (18-29%) and relatively stable hind fetlock readings. From April onwards, the hind hock numbers dropped dramatically — down to 1-5%. By conventional assessment at that point, the issue appeared resolved.
But from May, hind fetlock asymmetry began climbing: 13.8%, then 15.6%, then 14.5% and 16.0% by mid-June — the highest readings in that variable for this horse across the entire recording history.
As one asymmetry resolved, a different one emerged. Without the recording history, the April drop in hind hock would have looked like the end of the story. The data said otherwise.
Horse C — an individual owner, US.
Twenty-three recordings over three months. Hind hock asymmetry consistently between 0.5% and 9.6%. Hind fetlock between 0.4% and 6.0%. Front fetlock between 0.5% and 10.3%. No sustained changes, no emerging trends, no flags worth escalating.
This is what a stable baseline looks like. Not zero asymmetry — that does not exist. But consistent asymmetry, with no meaningful drift in any direction. The value here is not a discovery. It is reassurance, backed by data.
Why this matters
The standard approach to equine movement assessment is episodic. Something happens — a horse feels different, a race is coming up, a vet does a pre-purchase — and an assessment takes place. A snapshot is taken.
That snapshot has a fundamental problem: without a baseline, you cannot know if what you are seeing is normal for that horse or new. You are comparing the horse to a textbook, or to your memory of last time, or to nothing at all.
What our data shows is that normal is individual. Horse C, for example, has recorded hind hock asymmetry anywhere between 0.5% and 9.6% across 23 sessions, which is a normal range for that horse. If a recording came in at 14%, that would be worth attention. Not because 14% is inherently alarming, but because it sits outside what we know to be their pattern. You only know that if you have been measuring it.
TrojanTrack's approach is to build that baseline through routine, low-friction monitoring: a 10-second walk video, a report in minutes, recorded against the horse's own history. The value compounds over time. A third recording is more useful than a second. A tenth is more useful than a third. The trend matters more than any individual reading.
Over 95% of horses have a natural left/right movement pattern. Now that we can measure and track that pattern, the relevant question is not whether asymmetry exists — it does, in almost every horse. The relevant question is whether today's reading matches their normal.
A note on methodology
This analysis is based on recordings made under real-world yard conditions, not controlled laboratory settings. Filming angle, ground surface, horse behaviour, and operator technique all vary across the dataset. We have filtered aggressively for recording quality — only videos meeting our minimum standards for frame rate, resolution, and camera position are included, but the data reflects horses being monitored in practice, not in a gait lab.
All three case studies above are anonymised. Yards have not been asked to confirm clinical context for these cases, and TrojanTrack does not diagnose. The patterns described are movement patterns as measured by our system — not clinical conclusions. For any horse showing sustained changes, a qualified vet should be involved.
TrojanTrack is a smartphone-based equine movement monitoring platform based at the Irish National Stud, Kildare, Ireland. To learn more or start monitoring your yard, visit trojantrack.com.